|
Download Data (XLS File) |
|
|||||
|
|||||
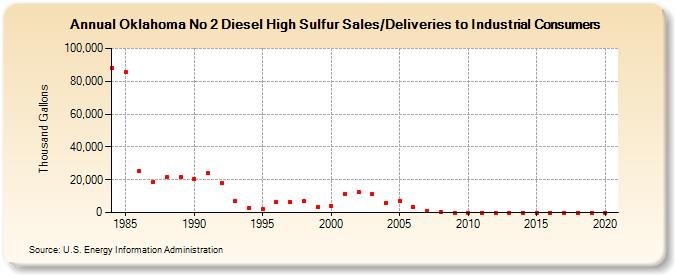
| Oklahoma No 2 Diesel High Sulfur Sales/Deliveries to Industrial Consumers (Thousand Gallons) | |||||
| Decade | Year-0 | Year-1 | Year-2 | Year-3 | Year-4 | Year-5 | Year-6 | Year-7 | Year-8 | Year-9 |
|---|---|---|---|---|---|---|---|---|---|---|
| 1980's | 88,010 | 85,389 | 25,129 | 18,847 | 21,534 | 21,721 | ||||
| 1990's | 20,605 | 24,351 | 17,788 | 6,907 | 2,901 | 1,884 | 6,492 | 6,628 | 6,759 | 3,466 |
| 2000's | 3,718 | 11,233 | 12,228 | 11,498 | 5,915 | 6,975 | 3,316 | 1,018 | 588 | 25 |
| 2010's | 1 | 0 | 0 | 0 | 0 | 0 | 0 | 0 | 0 | 0 |
| 2020's | 0 |
| - = No Data Reported; -- = Not Applicable; NA = Not Available; W = Withheld to avoid disclosure of individual company data. |
| Release Date: 2/9/2022 |
| Next Release Date: Suspended |