|
Download Data (XLS File) |
|
|||||
|
|||||
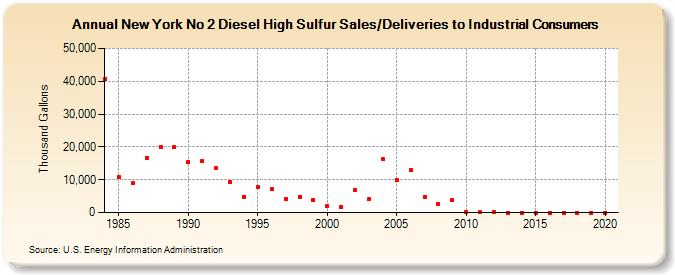
| New York No 2 Diesel High Sulfur Sales/Deliveries to Industrial Consumers (Thousand Gallons) | |||||
| Decade | Year-0 | Year-1 | Year-2 | Year-3 | Year-4 | Year-5 | Year-6 | Year-7 | Year-8 | Year-9 |
|---|---|---|---|---|---|---|---|---|---|---|
| 1980's | 40,721 | 10,765 | 9,046 | 16,717 | 19,861 | 20,022 | ||||
| 1990's | 15,393 | 15,771 | 13,443 | 9,317 | 4,837 | 7,765 | 7,064 | 4,136 | 4,844 | 3,765 |
| 2000's | 1,977 | 1,592 | 6,729 | 4,021 | 16,193 | 9,827 | 12,954 | 4,713 | 2,707 | 3,713 |
| 2010's | 222 | 46 | 170 | 0 | 0 | 0 | 0 | 0 | 0 | 0 |
| 2020's | 0 |
| - = No Data Reported; -- = Not Applicable; NA = Not Available; W = Withheld to avoid disclosure of individual company data. |
| Release Date: 2/9/2022 |
| Next Release Date: Suspended |