|
Download Data (XLS File) |
|
|||||
|
|||||
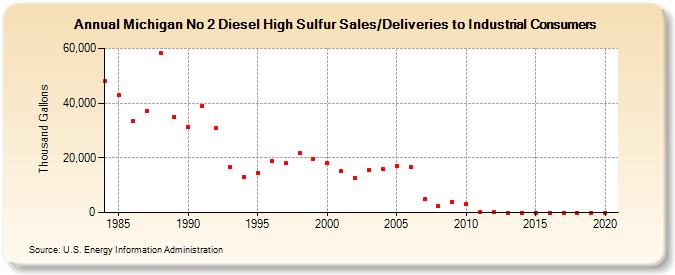
| Michigan No 2 Diesel High Sulfur Sales/Deliveries to Industrial Consumers (Thousand Gallons) | |||||
| Decade | Year-0 | Year-1 | Year-2 | Year-3 | Year-4 | Year-5 | Year-6 | Year-7 | Year-8 | Year-9 |
|---|---|---|---|---|---|---|---|---|---|---|
| 1980's | 48,081 | 42,803 | 33,524 | 37,010 | 58,436 | 34,873 | ||||
| 1990's | 31,221 | 38,979 | 31,056 | 16,566 | 12,819 | 14,504 | 18,957 | 18,242 | 21,739 | 19,615 |
| 2000's | 17,999 | 15,079 | 12,590 | 15,556 | 16,052 | 17,014 | 16,492 | 4,814 | 2,396 | 3,800 |
| 2010's | 3,305 | 192 | 112 | 0 | 0 | 0 | 0 | 0 | 0 | 0 |
| 2020's | 0 |
| - = No Data Reported; -- = Not Applicable; NA = Not Available; W = Withheld to avoid disclosure of individual company data. |
| Release Date: 2/9/2022 |
| Next Release Date: Suspended |