|
Download Data (XLS File) |
|
|||||
|
|||||
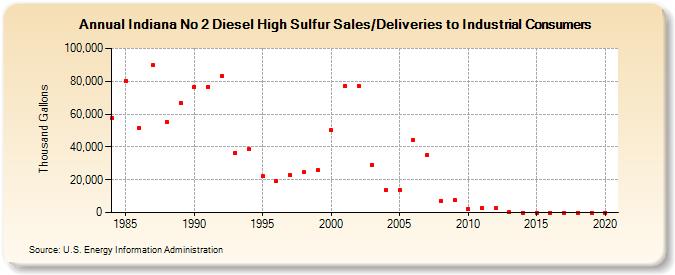
| Indiana No 2 Diesel High Sulfur Sales/Deliveries to Industrial Consumers (Thousand Gallons) | |||||
| Decade | Year-0 | Year-1 | Year-2 | Year-3 | Year-4 | Year-5 | Year-6 | Year-7 | Year-8 | Year-9 |
|---|---|---|---|---|---|---|---|---|---|---|
| 1980's | 57,705 | 80,364 | 51,547 | 89,627 | 55,192 | 66,893 | ||||
| 1990's | 76,641 | 76,735 | 83,300 | 36,458 | 38,532 | 22,042 | 19,190 | 22,938 | 24,514 | 25,644 |
| 2000's | 50,109 | 77,272 | 77,306 | 29,269 | 13,815 | 13,634 | 44,380 | 35,126 | 7,273 | 7,633 |
| 2010's | 2,251 | 2,963 | 2,717 | 185 | 0 | 0 | 0 | 0 | 0 | 0 |
| 2020's | 0 |
| - = No Data Reported; -- = Not Applicable; NA = Not Available; W = Withheld to avoid disclosure of individual company data. |
| Release Date: 2/9/2022 |
| Next Release Date: Suspended |