|
Download Data (XLS File) |
|
|||||
|
|||||
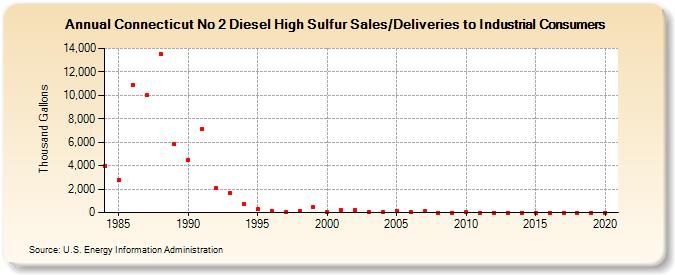
| Connecticut No 2 Diesel High Sulfur Sales/Deliveries to Industrial Consumers (Thousand Gallons) | |||||
| Decade | Year-0 | Year-1 | Year-2 | Year-3 | Year-4 | Year-5 | Year-6 | Year-7 | Year-8 | Year-9 |
|---|---|---|---|---|---|---|---|---|---|---|
| 1980's | 4,002 | 2,752 | 10,892 | 9,990 | 13,526 | 5,812 | ||||
| 1990's | 4,465 | 7,165 | 2,096 | 1,687 | 719 | 265 | 133 | 83 | 109 | 457 |
| 2000's | 51 | 235 | 177 | 59 | 32 | 158 | 31 | 106 | 0 | 0 |
| 2010's | 6 | 5 | 0 | 0 | 0 | 0 | 0 | 0 | 0 | 0 |
| 2020's | 0 |
| - = No Data Reported; -- = Not Applicable; NA = Not Available; W = Withheld to avoid disclosure of individual company data. |
| Release Date: 2/9/2022 |
| Next Release Date: Suspended |