|
Download Data (XLS File) |
|
|||||
|
|||||
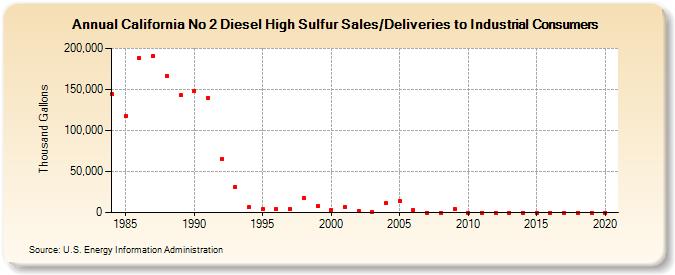
| California No 2 Diesel High Sulfur Sales/Deliveries to Industrial Consumers (Thousand Gallons) | |||||
| Decade | Year-0 | Year-1 | Year-2 | Year-3 | Year-4 | Year-5 | Year-6 | Year-7 | Year-8 | Year-9 |
|---|---|---|---|---|---|---|---|---|---|---|
| 1980's | 143,876 | 117,518 | 188,210 | 190,874 | 166,629 | 142,763 | ||||
| 1990's | 148,283 | 140,090 | 65,556 | 31,463 | 6,398 | 3,747 | 4,330 | 4,056 | 17,909 | 8,020 |
| 2000's | 3,351 | 7,223 | 1,896 | 908 | 11,589 | 14,318 | 2,955 | 0 | 0 | 4,036 |
| 2010's | 0 | 0 | 0 | 0 | 0 | 0 | 0 | 0 | 0 | 0 |
| 2020's | 0 |
| - = No Data Reported; -- = Not Applicable; NA = Not Available; W = Withheld to avoid disclosure of individual company data. |
| Release Date: 2/9/2022 |
| Next Release Date: Suspended |