|
Download Data (XLS File) |
|
|||||
|
|||||
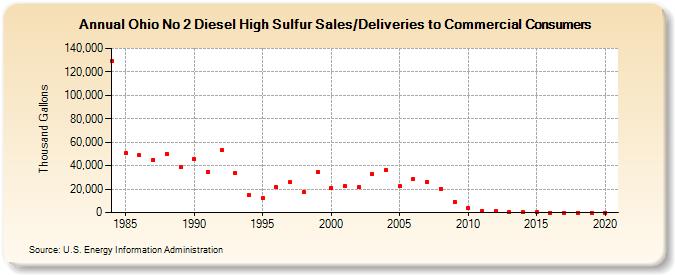
| Ohio No 2 Diesel High Sulfur Sales/Deliveries to Commercial Consumers (Thousand Gallons) | |||||
| Decade | Year-0 | Year-1 | Year-2 | Year-3 | Year-4 | Year-5 | Year-6 | Year-7 | Year-8 | Year-9 |
|---|---|---|---|---|---|---|---|---|---|---|
| 1980's | 129,329 | 50,476 | 48,842 | 45,132 | 50,123 | 38,857 | ||||
| 1990's | 45,397 | 34,599 | 53,188 | 33,522 | 15,267 | 12,570 | 21,764 | 25,742 | 17,372 | 34,720 |
| 2000's | 20,689 | 22,609 | 21,675 | 32,809 | 36,369 | 22,298 | 28,782 | 26,340 | 20,410 | 9,277 |
| 2010's | 3,695 | 1,440 | 931 | 119 | 123 | 97 | 0 | 0 | 0 | 0 |
| 2020's | 0 |
| - = No Data Reported; -- = Not Applicable; NA = Not Available; W = Withheld to avoid disclosure of individual company data. |
| Release Date: 2/9/2022 |
| Next Release Date: Suspended |