|
Download Data (XLS File) |
|
|||||
|
|||||
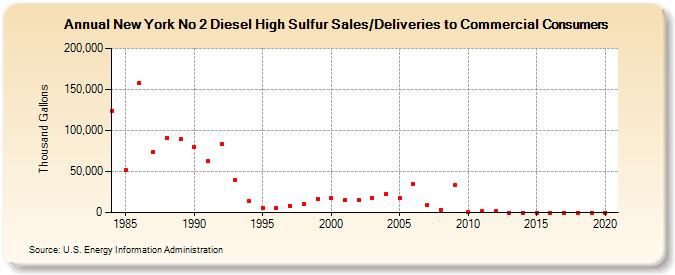
| New York No 2 Diesel High Sulfur Sales/Deliveries to Commercial Consumers (Thousand Gallons) | |||||
| Decade | Year-0 | Year-1 | Year-2 | Year-3 | Year-4 | Year-5 | Year-6 | Year-7 | Year-8 | Year-9 |
|---|---|---|---|---|---|---|---|---|---|---|
| 1980's | 123,772 | 51,261 | 158,044 | 73,880 | 91,249 | 89,553 | ||||
| 1990's | 80,273 | 62,991 | 83,033 | 39,147 | 14,011 | 6,023 | 5,386 | 8,457 | 10,166 | 16,999 |
| 2000's | 17,775 | 15,290 | 15,780 | 17,943 | 23,112 | 17,866 | 34,988 | 8,818 | 3,575 | 33,202 |
| 2010's | 167 | 1,564 | 1,826 | 0 | 0 | 0 | 0 | 0 | 0 | 0 |
| 2020's | 0 |
| - = No Data Reported; -- = Not Applicable; NA = Not Available; W = Withheld to avoid disclosure of individual company data. |
| Release Date: 2/9/2022 |
| Next Release Date: Suspended |