|
Download Data (XLS File) |
|
|||||
|
|||||
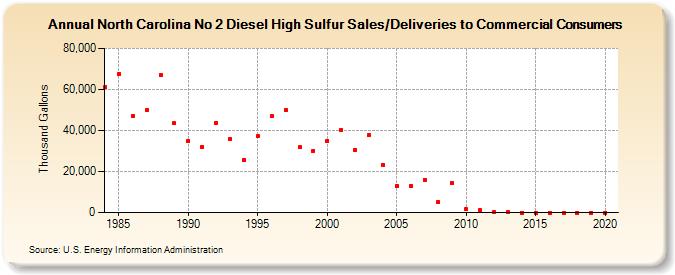
| North Carolina No 2 Diesel High Sulfur Sales/Deliveries to Commercial Consumers (Thousand Gallons) | |||||
| Decade | Year-0 | Year-1 | Year-2 | Year-3 | Year-4 | Year-5 | Year-6 | Year-7 | Year-8 | Year-9 |
|---|---|---|---|---|---|---|---|---|---|---|
| 1980's | 61,183 | 67,737 | 46,961 | 49,784 | 66,917 | 43,497 | ||||
| 1990's | 35,049 | 32,123 | 43,688 | 35,846 | 25,641 | 37,236 | 47,041 | 49,911 | 31,728 | 30,213 |
| 2000's | 34,972 | 40,261 | 30,507 | 37,759 | 23,361 | 13,069 | 12,962 | 16,088 | 5,145 | 14,432 |
| 2010's | 1,522 | 1,157 | 321 | 263 | 0 | 0 | 0 | 0 | 0 | 0 |
| 2020's | 0 |
| - = No Data Reported; -- = Not Applicable; NA = Not Available; W = Withheld to avoid disclosure of individual company data. |
| Release Date: 2/9/2022 |
| Next Release Date: Suspended |