|
Download Data (XLS File) |
|
|||||
|
|||||
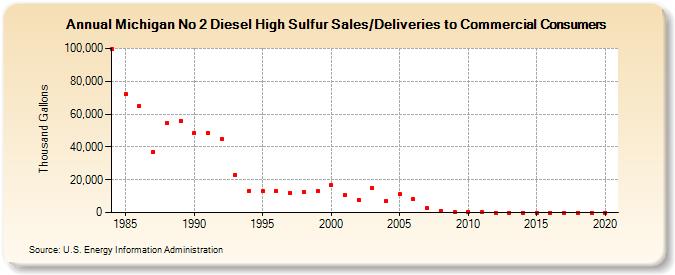
| Michigan No 2 Diesel High Sulfur Sales/Deliveries to Commercial Consumers (Thousand Gallons) | |||||
| Decade | Year-0 | Year-1 | Year-2 | Year-3 | Year-4 | Year-5 | Year-6 | Year-7 | Year-8 | Year-9 |
|---|---|---|---|---|---|---|---|---|---|---|
| 1980's | 99,876 | 71,977 | 65,000 | 36,907 | 54,581 | 55,888 | ||||
| 1990's | 48,315 | 48,623 | 45,028 | 23,098 | 13,360 | 12,829 | 13,036 | 12,139 | 12,749 | 12,980 |
| 2000's | 16,608 | 10,945 | 7,890 | 14,768 | 6,991 | 11,129 | 8,071 | 2,538 | 986 | 315 |
| 2010's | 359 | 235 | 0 | 0 | 0 | 0 | 0 | 0 | 0 | 0 |
| 2020's | 0 |
| - = No Data Reported; -- = Not Applicable; NA = Not Available; W = Withheld to avoid disclosure of individual company data. |
| Release Date: 2/9/2022 |
| Next Release Date: Suspended |