|
Download Data (XLS File) |
|
|||||
|
|||||
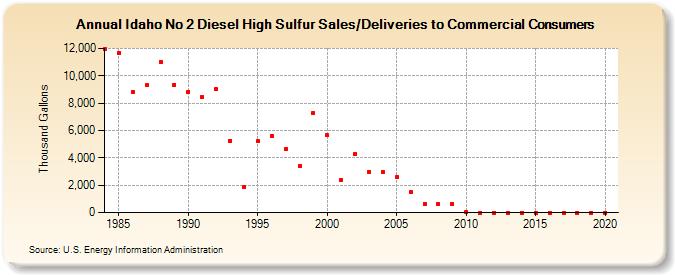
| Idaho No 2 Diesel High Sulfur Sales/Deliveries to Commercial Consumers (Thousand Gallons) | |||||
| Decade | Year-0 | Year-1 | Year-2 | Year-3 | Year-4 | Year-5 | Year-6 | Year-7 | Year-8 | Year-9 |
|---|---|---|---|---|---|---|---|---|---|---|
| 1980's | 11,970 | 11,676 | 8,847 | 9,299 | 11,040 | 9,353 | ||||
| 1990's | 8,842 | 8,475 | 8,996 | 5,250 | 1,886 | 5,224 | 5,626 | 4,645 | 3,385 | 7,295 |
| 2000's | 5,644 | 2,411 | 4,271 | 2,973 | 2,958 | 2,574 | 1,482 | 641 | 641 | 646 |
| 2010's | 41 | 0 | 0 | 0 | 0 | 0 | 0 | 0 | 0 | 0 |
| 2020's | 0 |
| - = No Data Reported; -- = Not Applicable; NA = Not Available; W = Withheld to avoid disclosure of individual company data. |
| Release Date: 2/9/2022 |
| Next Release Date: Suspended |