|
Download Data (XLS File) |
|
|||||
|
|||||
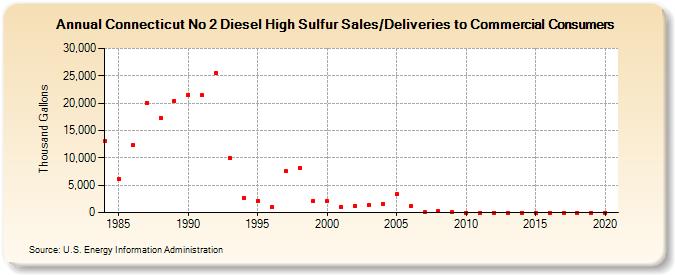
| Connecticut No 2 Diesel High Sulfur Sales/Deliveries to Commercial Consumers (Thousand Gallons) | |||||
| Decade | Year-0 | Year-1 | Year-2 | Year-3 | Year-4 | Year-5 | Year-6 | Year-7 | Year-8 | Year-9 |
|---|---|---|---|---|---|---|---|---|---|---|
| 1980's | 13,058 | 6,184 | 12,338 | 20,106 | 17,358 | 20,393 | ||||
| 1990's | 21,573 | 21,435 | 25,508 | 9,937 | 2,721 | 2,203 | 962 | 7,507 | 8,204 | 2,107 |
| 2000's | 2,045 | 1,068 | 1,279 | 1,357 | 1,602 | 3,323 | 1,132 | 112 | 263 | 11 |
| 2010's | 1 | 4 | 0 | 0 | 0 | 0 | 0 | 0 | 0 | 0 |
| 2020's | 0 |
| - = No Data Reported; -- = Not Applicable; NA = Not Available; W = Withheld to avoid disclosure of individual company data. |
| Release Date: 2/9/2022 |
| Next Release Date: Suspended |