|
Download Data (XLS File) |
|
|||||
|
|||||
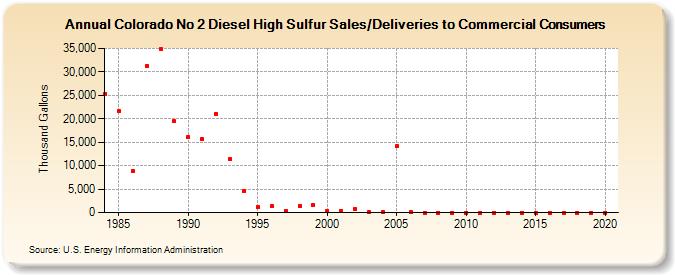
| Colorado No 2 Diesel High Sulfur Sales/Deliveries to Commercial Consumers (Thousand Gallons) | |||||
| Decade | Year-0 | Year-1 | Year-2 | Year-3 | Year-4 | Year-5 | Year-6 | Year-7 | Year-8 | Year-9 |
|---|---|---|---|---|---|---|---|---|---|---|
| 1980's | 25,284 | 21,641 | 8,875 | 31,142 | 34,899 | 19,451 | ||||
| 1990's | 16,090 | 15,676 | 21,038 | 11,374 | 4,544 | 1,219 | 1,311 | 439 | 1,375 | 1,507 |
| 2000's | 424 | 343 | 757 | 19 | 157 | 14,111 | 158 | 0 | 1 | 0 |
| 2010's | 0 | 0 | 0 | 0 | 0 | 0 | 0 | 0 | 0 | 0 |
| 2020's | 0 |
| - = No Data Reported; -- = Not Applicable; NA = Not Available; W = Withheld to avoid disclosure of individual company data. |
| Release Date: 2/9/2022 |
| Next Release Date: Suspended |