|
Download Data (XLS File) |
|
|||||
|
|||||
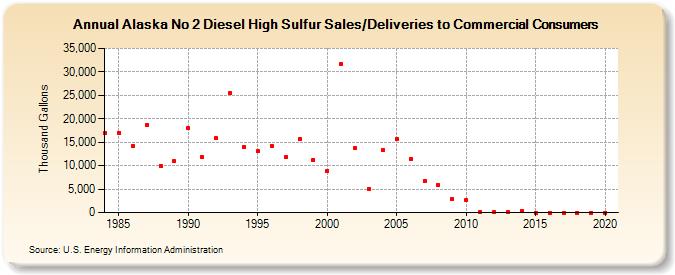
| Alaska No 2 Diesel High Sulfur Sales/Deliveries to Commercial Consumers (Thousand Gallons) | |||||
| Decade | Year-0 | Year-1 | Year-2 | Year-3 | Year-4 | Year-5 | Year-6 | Year-7 | Year-8 | Year-9 |
|---|---|---|---|---|---|---|---|---|---|---|
| 1980's | 16,894 | 17,057 | 14,142 | 18,736 | 10,017 | 10,902 | ||||
| 1990's | 17,997 | 11,806 | 15,829 | 25,494 | 14,053 | 13,067 | 14,257 | 11,832 | 15,657 | 11,246 |
| 2000's | 8,953 | 31,675 | 13,689 | 5,111 | 13,339 | 15,709 | 11,420 | 6,691 | 5,867 | 2,870 |
| 2010's | 2,587 | 123 | 169 | 119 | 437 | 0 | 0 | 0 | 0 | 0 |
| 2020's | 0 |
| - = No Data Reported; -- = Not Applicable; NA = Not Available; W = Withheld to avoid disclosure of individual company data. |
| Release Date: 2/9/2022 |
| Next Release Date: Suspended |