|
Download Data (XLS File) |
|
|||||
|
|||||
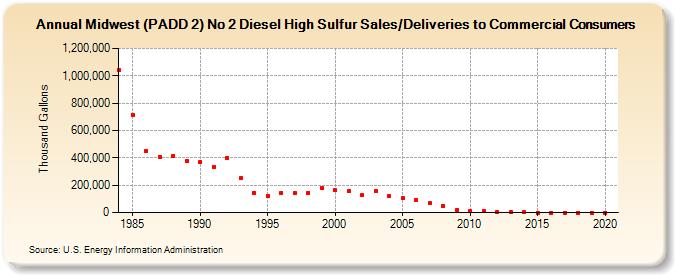
| Midwest (PADD 2) No 2 Diesel High Sulfur Sales/Deliveries to Commercial Consumers (Thousand Gallons) | |||||
| Decade | Year-0 | Year-1 | Year-2 | Year-3 | Year-4 | Year-5 | Year-6 | Year-7 | Year-8 | Year-9 |
|---|---|---|---|---|---|---|---|---|---|---|
| 1980's | 1,040,671 | 716,363 | 448,567 | 404,774 | 413,050 | 377,422 | ||||
| 1990's | 369,603 | 335,887 | 402,380 | 251,302 | 145,174 | 121,280 | 145,785 | 140,531 | 146,466 | 180,484 |
| 2000's | 162,191 | 155,606 | 125,065 | 155,082 | 118,881 | 105,481 | 91,602 | 66,226 | 49,155 | 18,480 |
| 2010's | 10,909 | 8,303 | 3,362 | 1,314 | 542 | 97 | 0 | 0 | 0 | 0 |
| 2020's | 0 |
| - = No Data Reported; -- = Not Applicable; NA = Not Available; W = Withheld to avoid disclosure of individual company data. |
| Release Date: 2/9/2022 |
| Next Release Date: Suspended |