|
Download Data (XLS File) |
|
|||||
|
|||||
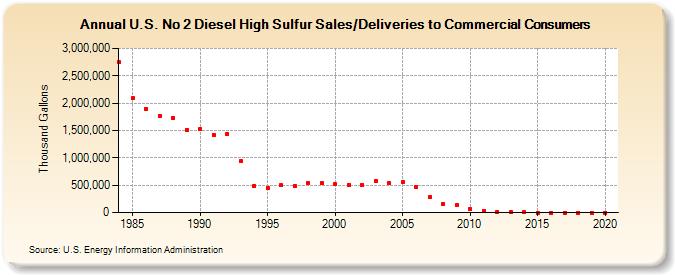
| U.S. No 2 Diesel High Sulfur Sales/Deliveries to Commercial Consumers (Thousand Gallons) | |||||
| Decade | Year-0 | Year-1 | Year-2 | Year-3 | Year-4 | Year-5 | Year-6 | Year-7 | Year-8 | Year-9 |
|---|---|---|---|---|---|---|---|---|---|---|
| 1980's | 2,744,054 | 2,089,469 | 1,898,558 | 1,770,592 | 1,735,145 | 1,515,732 | ||||
| 1990's | 1,526,742 | 1,421,323 | 1,428,990 | 939,338 | 493,796 | 451,279 | 498,422 | 488,114 | 531,096 | 539,094 |
| 2000's | 515,834 | 509,846 | 511,828 | 569,490 | 535,568 | 550,024 | 469,420 | 280,932 | 162,132 | 130,288 |
| 2010's | 65,520 | 36,958 | 17,801 | 6,204 | 1,836 | 452 | 0 | 0 | 0 | 0 |
| 2020's | 0 |
| - = No Data Reported; -- = Not Applicable; NA = Not Available; W = Withheld to avoid disclosure of individual company data. |
| Release Date: 2/9/2022 |
| Next Release Date: Suspended |