|
Download Data (XLS File) |
|
|||||
|
|||||
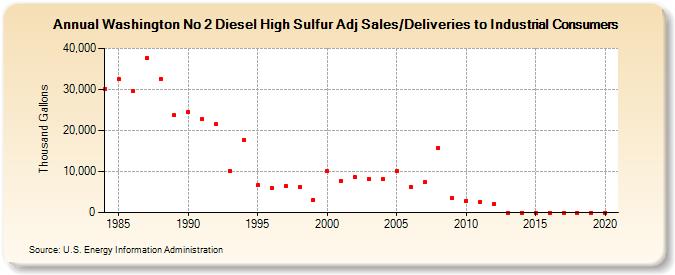
| Washington No 2 Diesel High Sulfur Adj Sales/Deliveries to Industrial Consumers (Thousand Gallons) | |||||
| Decade | Year-0 | Year-1 | Year-2 | Year-3 | Year-4 | Year-5 | Year-6 | Year-7 | Year-8 | Year-9 |
|---|---|---|---|---|---|---|---|---|---|---|
| 1980's | 30,214 | 32,462 | 29,645 | 37,653 | 32,636 | 23,677 | ||||
| 1990's | 24,576 | 22,844 | 21,467 | 10,129 | 17,791 | 6,613 | 6,015 | 6,480 | 6,309 | 3,100 |
| 2000's | 10,124 | 7,708 | 8,552 | 8,217 | 8,083 | 10,084 | 6,338 | 7,386 | 15,742 | 3,559 |
| 2010's | 2,878 | 2,635 | 2,120 | 0 | 0 | 0 | 0 | 0 | 0 | 0 |
| 2020's | 0 |
| - = No Data Reported; -- = Not Applicable; NA = Not Available; W = Withheld to avoid disclosure of individual company data. |
| Release Date: 2/9/2022 |
| Next Release Date: Suspended |