|
Download Data (XLS File) |
|
|||||
|
|||||
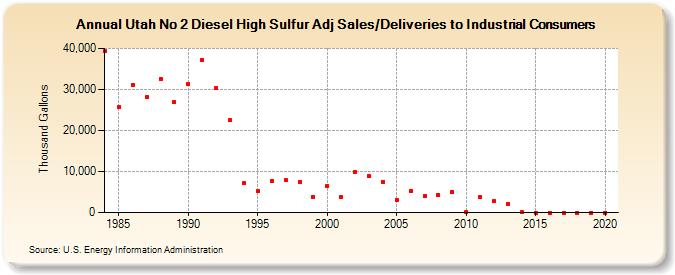
| Utah No 2 Diesel High Sulfur Adj Sales/Deliveries to Industrial Consumers (Thousand Gallons) | |||||
| Decade | Year-0 | Year-1 | Year-2 | Year-3 | Year-4 | Year-5 | Year-6 | Year-7 | Year-8 | Year-9 |
|---|---|---|---|---|---|---|---|---|---|---|
| 1980's | 39,339 | 25,709 | 31,160 | 28,124 | 32,544 | 26,902 | ||||
| 1990's | 31,275 | 37,280 | 30,320 | 22,494 | 7,134 | 5,298 | 7,757 | 7,863 | 7,533 | 3,838 |
| 2000's | 6,471 | 3,700 | 9,933 | 8,798 | 7,565 | 3,179 | 5,218 | 3,969 | 4,327 | 5,037 |
| 2010's | 153 | 3,812 | 2,870 | 2,194 | 48 | 0 | 0 | 0 | 0 | 0 |
| 2020's | 0 |
| - = No Data Reported; -- = Not Applicable; NA = Not Available; W = Withheld to avoid disclosure of individual company data. |
| Release Date: 2/9/2022 |
| Next Release Date: Suspended |