|
Download Data (XLS File) |
|
|||||
|
|||||
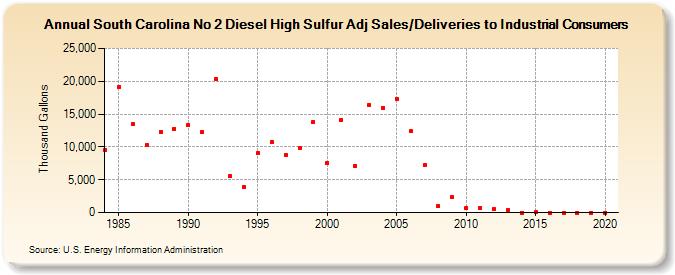
| South Carolina No 2 Diesel High Sulfur Adj Sales/Deliveries to Industrial Consumers (Thousand Gallons) | |||||
| Decade | Year-0 | Year-1 | Year-2 | Year-3 | Year-4 | Year-5 | Year-6 | Year-7 | Year-8 | Year-9 |
|---|---|---|---|---|---|---|---|---|---|---|
| 1980's | 9,593 | 19,195 | 13,463 | 10,323 | 12,300 | 12,794 | ||||
| 1990's | 13,301 | 12,258 | 20,338 | 5,565 | 3,915 | 9,066 | 10,730 | 8,809 | 9,906 | 13,778 |
| 2000's | 7,549 | 14,141 | 7,139 | 16,404 | 15,963 | 17,361 | 12,388 | 7,203 | 981 | 2,330 |
| 2010's | 696 | 695 | 539 | 318 | 0 | 67 | 0 | 0 | 0 | 0 |
| 2020's | 0 |
| - = No Data Reported; -- = Not Applicable; NA = Not Available; W = Withheld to avoid disclosure of individual company data. |
| Release Date: 2/9/2022 |
| Next Release Date: Suspended |