|
Download Data (XLS File) |
|
|||||
|
|||||
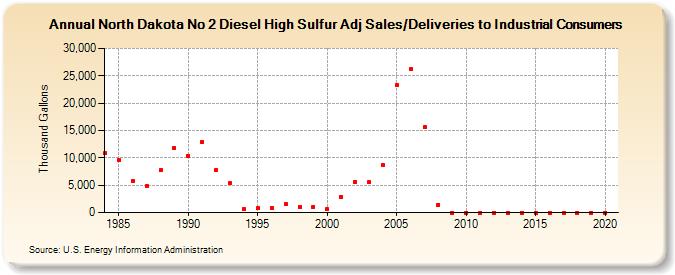
| North Dakota No 2 Diesel High Sulfur Adj Sales/Deliveries to Industrial Consumers (Thousand Gallons) | |||||
| Decade | Year-0 | Year-1 | Year-2 | Year-3 | Year-4 | Year-5 | Year-6 | Year-7 | Year-8 | Year-9 |
|---|---|---|---|---|---|---|---|---|---|---|
| 1980's | 10,877 | 9,523 | 5,738 | 4,889 | 7,772 | 11,824 | ||||
| 1990's | 10,408 | 12,958 | 7,778 | 5,316 | 627 | 764 | 888 | 1,484 | 1,065 | 1,105 |
| 2000's | 582 | 2,913 | 5,585 | 5,503 | 8,626 | 23,331 | 26,214 | 15,599 | 1,467 | 0 |
| 2010's | 0 | 0 | 1 | 0 | 0 | 0 | 0 | 0 | 0 | 0 |
| 2020's | 0 |
| - = No Data Reported; -- = Not Applicable; NA = Not Available; W = Withheld to avoid disclosure of individual company data. |
| Release Date: 2/9/2022 |
| Next Release Date: Suspended |