|
Download Data (XLS File) |
|
|||||
|
|||||
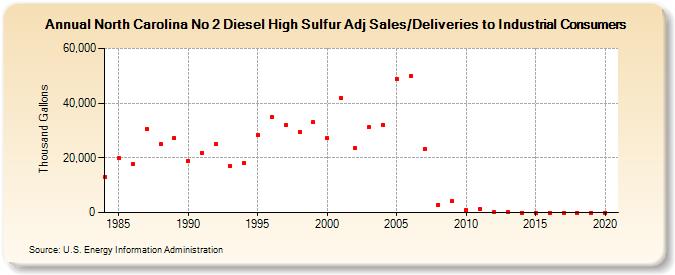
| North Carolina No 2 Diesel High Sulfur Adj Sales/Deliveries to Industrial Consumers (Thousand Gallons) | |||||
| Decade | Year-0 | Year-1 | Year-2 | Year-3 | Year-4 | Year-5 | Year-6 | Year-7 | Year-8 | Year-9 |
|---|---|---|---|---|---|---|---|---|---|---|
| 1980's | 13,125 | 19,787 | 17,863 | 30,539 | 24,947 | 27,282 | ||||
| 1990's | 18,707 | 21,925 | 24,934 | 17,085 | 18,251 | 28,451 | 34,772 | 31,999 | 29,587 | 32,938 |
| 2000's | 27,181 | 41,997 | 23,669 | 31,162 | 32,111 | 48,967 | 50,020 | 23,163 | 2,799 | 4,134 |
| 2010's | 962 | 1,319 | 225 | 148 | 0 | 0 | 0 | 0 | 0 | 0 |
| 2020's | 0 |
| - = No Data Reported; -- = Not Applicable; NA = Not Available; W = Withheld to avoid disclosure of individual company data. |
| Release Date: 2/9/2022 |
| Next Release Date: Suspended |