|
Download Data (XLS File) |
|
|||||
|
|||||
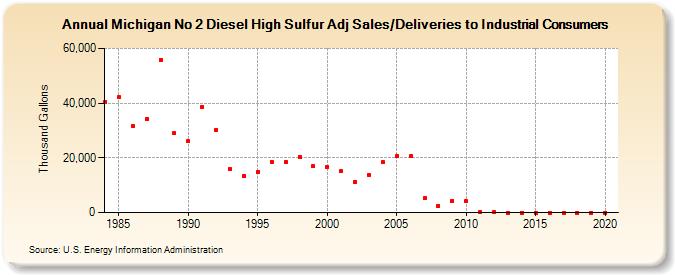
| Michigan No 2 Diesel High Sulfur Adj Sales/Deliveries to Industrial Consumers (Thousand Gallons) | |||||
| Decade | Year-0 | Year-1 | Year-2 | Year-3 | Year-4 | Year-5 | Year-6 | Year-7 | Year-8 | Year-9 |
|---|---|---|---|---|---|---|---|---|---|---|
| 1980's | 40,416 | 42,113 | 31,505 | 34,250 | 55,882 | 28,944 | ||||
| 1990's | 25,979 | 38,674 | 30,334 | 15,896 | 13,449 | 14,922 | 18,580 | 18,650 | 20,459 | 16,912 |
| 2000's | 16,805 | 15,041 | 11,222 | 13,891 | 18,383 | 20,539 | 20,662 | 5,295 | 2,544 | 4,325 |
| 2010's | 4,076 | 217 | 132 | 0 | 0 | 0 | 0 | 0 | 0 | 0 |
| 2020's | 0 |
| - = No Data Reported; -- = Not Applicable; NA = Not Available; W = Withheld to avoid disclosure of individual company data. |
| Release Date: 2/9/2022 |
| Next Release Date: Suspended |