|
Download Data (XLS File) |
|
|||||
|
|||||
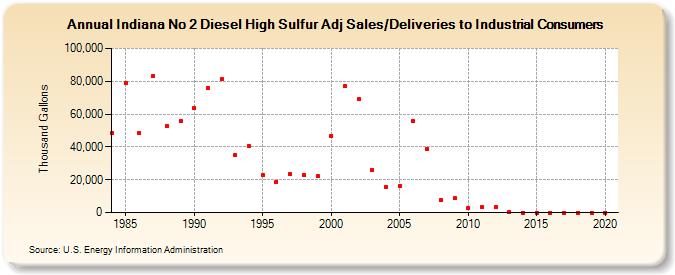
| Indiana No 2 Diesel High Sulfur Adj Sales/Deliveries to Industrial Consumers (Thousand Gallons) | |||||
| Decade | Year-0 | Year-1 | Year-2 | Year-3 | Year-4 | Year-5 | Year-6 | Year-7 | Year-8 | Year-9 |
|---|---|---|---|---|---|---|---|---|---|---|
| 1980's | 48,505 | 79,069 | 48,444 | 82,941 | 52,780 | 55,520 | ||||
| 1990's | 63,771 | 76,135 | 81,363 | 34,983 | 40,427 | 22,678 | 18,808 | 23,451 | 23,071 | 22,110 |
| 2000's | 46,786 | 77,080 | 68,904 | 26,137 | 15,821 | 16,458 | 55,603 | 38,637 | 7,722 | 8,687 |
| 2010's | 2,777 | 3,352 | 3,187 | 206 | 0 | 0 | 0 | 0 | 0 | 0 |
| 2020's | 0 |
| - = No Data Reported; -- = Not Applicable; NA = Not Available; W = Withheld to avoid disclosure of individual company data. |
| Release Date: 2/9/2022 |
| Next Release Date: Suspended |