|
Download Data (XLS File) |
|
|||||
|
|||||
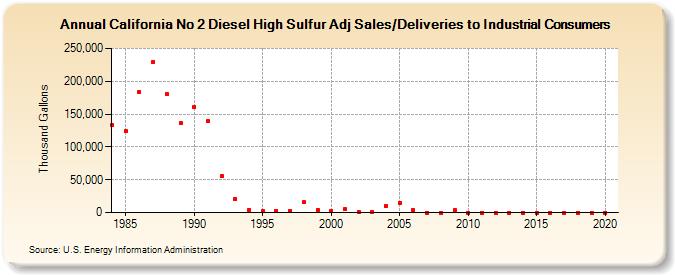
| California No 2 Diesel High Sulfur Adj Sales/Deliveries to Industrial Consumers (Thousand Gallons) | |||||
| Decade | Year-0 | Year-1 | Year-2 | Year-3 | Year-4 | Year-5 | Year-6 | Year-7 | Year-8 | Year-9 |
|---|---|---|---|---|---|---|---|---|---|---|
| 1980's | 132,599 | 123,468 | 183,437 | 229,494 | 180,355 | 136,428 | ||||
| 1990's | 160,664 | 139,305 | 55,711 | 20,423 | 3,951 | 2,632 | 2,850 | 3,077 | 15,783 | 4,493 |
| 2000's | 2,057 | 4,720 | 1,561 | 937 | 10,617 | 14,975 | 3,233 | 0 | 0 | 3,490 |
| 2010's | 0 | 0 | 0 | 0 | 0 | 0 | 0 | 0 | 0 | 0 |
| 2020's | 0 |
| - = No Data Reported; -- = Not Applicable; NA = Not Available; W = Withheld to avoid disclosure of individual company data. |
| Release Date: 2/9/2022 |
| Next Release Date: Suspended |