|
Download Data (XLS File) |
|
|||||
|
|||||
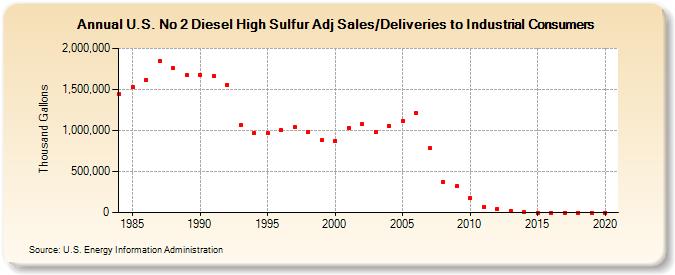
| U.S. No 2 Diesel High Sulfur Adj Sales/Deliveries to Industrial Consumers (Thousand Gallons) | |||||
| Decade | Year-0 | Year-1 | Year-2 | Year-3 | Year-4 | Year-5 | Year-6 | Year-7 | Year-8 | Year-9 |
|---|---|---|---|---|---|---|---|---|---|---|
| 1980's | 1,446,263 | 1,528,618 | 1,618,497 | 1,850,721 | 1,756,921 | 1,677,756 | ||||
| 1990's | 1,680,732 | 1,663,424 | 1,560,057 | 1,062,779 | 975,237 | 968,078 | 1,004,883 | 1,042,657 | 978,661 | 880,483 |
| 2000's | 875,275 | 1,035,675 | 1,075,132 | 983,171 | 1,056,568 | 1,117,746 | 1,213,458 | 781,476 | 377,395 | 319,170 |
| 2010's | 176,972 | 71,240 | 44,259 | 20,083 | 2,740 | 311 | 2 | 17 | 21 | 8 |
| 2020's | 24 |
| - = No Data Reported; -- = Not Applicable; NA = Not Available; W = Withheld to avoid disclosure of individual company data. |
| Release Date: 2/9/2022 |
| Next Release Date: Suspended |