|
Download Data (XLS File) |
|
|||||
|
|||||
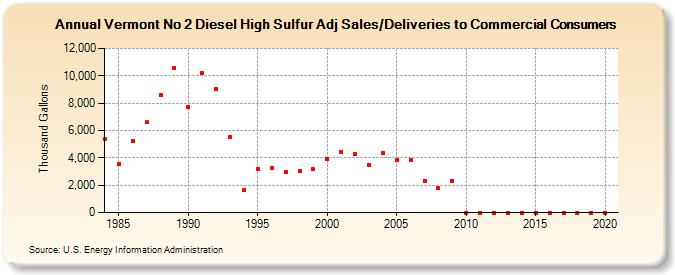
| Vermont No 2 Diesel High Sulfur Adj Sales/Deliveries to Commercial Consumers (Thousand Gallons) | |||||
| Decade | Year-0 | Year-1 | Year-2 | Year-3 | Year-4 | Year-5 | Year-6 | Year-7 | Year-8 | Year-9 |
|---|---|---|---|---|---|---|---|---|---|---|
| 1980's | 5,354 | 3,520 | 5,243 | 6,592 | 8,627 | 10,536 | ||||
| 1990's | 7,712 | 10,167 | 9,003 | 5,541 | 1,667 | 3,210 | 3,257 | 2,947 | 3,052 | 3,154 |
| 2000's | 3,910 | 4,415 | 4,286 | 3,473 | 4,355 | 3,842 | 3,815 | 2,313 | 1,769 | 2,330 |
| 2010's | 0 | 0 | 0 | 0 | 0 | 0 | 0 | 0 | 0 | 0 |
| 2020's | 0 |
| - = No Data Reported; -- = Not Applicable; NA = Not Available; W = Withheld to avoid disclosure of individual company data. |
| Release Date: 2/9/2022 |
| Next Release Date: Suspended |