|
Download Data (XLS File) |
|
|||||
|
|||||
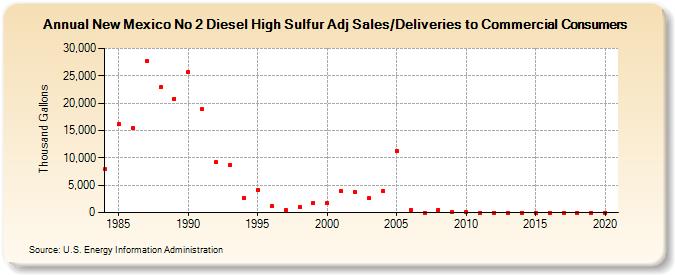
| New Mexico No 2 Diesel High Sulfur Adj Sales/Deliveries to Commercial Consumers (Thousand Gallons) | |||||
| Decade | Year-0 | Year-1 | Year-2 | Year-3 | Year-4 | Year-5 | Year-6 | Year-7 | Year-8 | Year-9 |
|---|---|---|---|---|---|---|---|---|---|---|
| 1980's | 7,908 | 16,112 | 15,361 | 27,656 | 22,896 | 20,824 | ||||
| 1990's | 25,706 | 18,841 | 9,212 | 8,684 | 2,695 | 4,158 | 1,114 | 455 | 1,055 | 1,777 |
| 2000's | 1,696 | 3,902 | 3,765 | 2,612 | 3,929 | 11,254 | 433 | 6 | 525 | 119 |
| 2010's | 71 | 0 | 0 | 0 | 0 | 0 | 0 | 0 | 0 | 0 |
| 2020's | 0 |
| - = No Data Reported; -- = Not Applicable; NA = Not Available; W = Withheld to avoid disclosure of individual company data. |
| Release Date: 2/9/2022 |
| Next Release Date: Suspended |