|
Download Data (XLS File) |
|
|||||
|
|||||
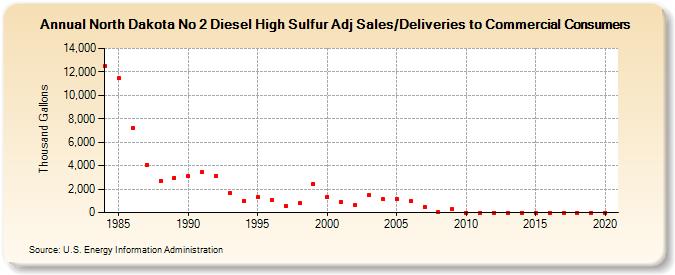
| North Dakota No 2 Diesel High Sulfur Adj Sales/Deliveries to Commercial Consumers (Thousand Gallons) | |||||
| Decade | Year-0 | Year-1 | Year-2 | Year-3 | Year-4 | Year-5 | Year-6 | Year-7 | Year-8 | Year-9 |
|---|---|---|---|---|---|---|---|---|---|---|
| 1980's | 12,486 | 11,457 | 7,223 | 4,095 | 2,720 | 2,978 | ||||
| 1990's | 3,096 | 3,468 | 3,133 | 1,681 | 1,007 | 1,324 | 1,072 | 560 | 806 | 2,439 |
| 2000's | 1,332 | 915 | 621 | 1,470 | 1,128 | 1,158 | 945 | 505 | 15 | 312 |
| 2010's | 0 | 0 | 0 | 0 | 0 | 0 | 0 | 0 | 0 | 0 |
| 2020's | 0 |
| - = No Data Reported; -- = Not Applicable; NA = Not Available; W = Withheld to avoid disclosure of individual company data. |
| Release Date: 2/9/2022 |
| Next Release Date: Suspended |