|
Download Data (XLS File) |
|
|||||
|
|||||
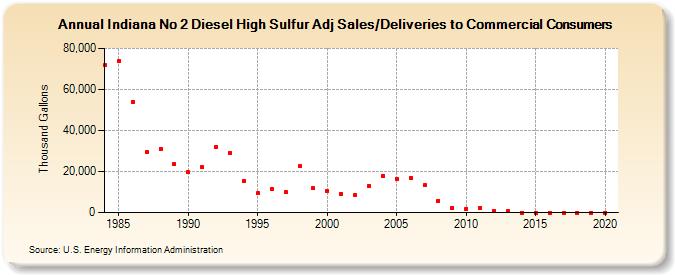
| Indiana No 2 Diesel High Sulfur Adj Sales/Deliveries to Commercial Consumers (Thousand Gallons) | |||||
| Decade | Year-0 | Year-1 | Year-2 | Year-3 | Year-4 | Year-5 | Year-6 | Year-7 | Year-8 | Year-9 |
|---|---|---|---|---|---|---|---|---|---|---|
| 1980's | 71,850 | 73,699 | 53,816 | 29,333 | 31,080 | 23,550 | ||||
| 1990's | 19,586 | 22,085 | 31,965 | 29,265 | 15,402 | 9,386 | 11,719 | 9,914 | 22,540 | 11,782 |
| 2000's | 10,547 | 9,286 | 8,743 | 12,973 | 18,037 | 16,536 | 17,083 | 13,236 | 5,810 | 2,414 |
| 2010's | 1,862 | 2,461 | 982 | 690 | 0 | 0 | 0 | 0 | 0 | 0 |
| 2020's | 0 |
| - = No Data Reported; -- = Not Applicable; NA = Not Available; W = Withheld to avoid disclosure of individual company data. |
| Release Date: 2/9/2022 |
| Next Release Date: Suspended |