|
Download Data (XLS File) |
|
|||||
|
|||||
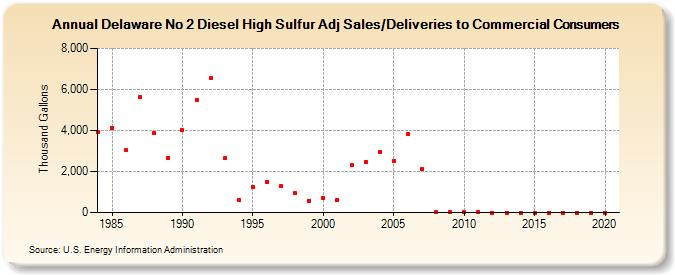
| Delaware No 2 Diesel High Sulfur Adj Sales/Deliveries to Commercial Consumers (Thousand Gallons) | |||||
| Decade | Year-0 | Year-1 | Year-2 | Year-3 | Year-4 | Year-5 | Year-6 | Year-7 | Year-8 | Year-9 |
|---|---|---|---|---|---|---|---|---|---|---|
| 1980's | 3,918 | 4,133 | 3,032 | 5,626 | 3,860 | 2,681 | ||||
| 1990's | 4,003 | 5,467 | 6,537 | 2,635 | 607 | 1,264 | 1,481 | 1,273 | 948 | 567 |
| 2000's | 717 | 636 | 2,302 | 2,485 | 2,967 | 2,527 | 3,826 | 2,130 | 14 | 25 |
| 2010's | 4 | 19 | 0 | 0 | 0 | 0 | 0 | 0 | 0 | 0 |
| 2020's | 0 |
| - = No Data Reported; -- = Not Applicable; NA = Not Available; W = Withheld to avoid disclosure of individual company data. |
| Release Date: 2/9/2022 |
| Next Release Date: Suspended |