|
Download Data (XLS File) |
|
|||||
|
|||||
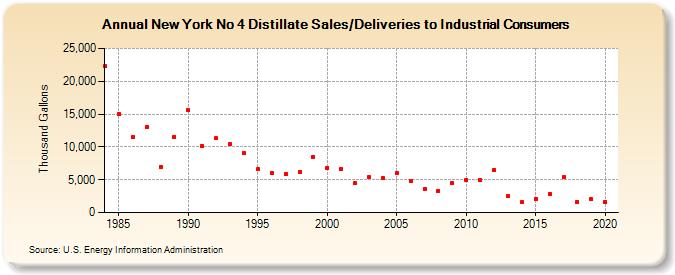
| New York No 4 Distillate Sales/Deliveries to Industrial Consumers (Thousand Gallons) | |||||
| Decade | Year-0 | Year-1 | Year-2 | Year-3 | Year-4 | Year-5 | Year-6 | Year-7 | Year-8 | Year-9 |
|---|---|---|---|---|---|---|---|---|---|---|
| 1980's | 22,245 | 14,997 | 11,541 | 13,061 | 7,012 | 11,553 | ||||
| 1990's | 15,571 | 10,186 | 11,298 | 10,409 | 9,002 | 6,572 | 6,012 | 5,848 | 6,236 | 8,510 |
| 2000's | 6,836 | 6,671 | 4,459 | 5,393 | 5,236 | 5,996 | 4,835 | 3,572 | 3,268 | 4,467 |
| 2010's | 4,891 | 4,942 | 6,528 | 2,446 | 1,547 | 2,007 | 2,899 | 5,434 | 1,682 | 2,009 |
| 2020's | 1,651 |
| - = No Data Reported; -- = Not Applicable; NA = Not Available; W = Withheld to avoid disclosure of individual company data. |
| Release Date: 2/9/2022 |
| Next Release Date: Suspended |