|
Download Data (XLS File) |
|
|||||
|
|||||
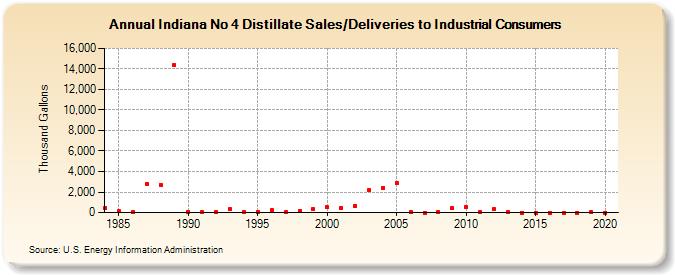
| Indiana No 4 Distillate Sales/Deliveries to Industrial Consumers (Thousand Gallons) | |||||
| Decade | Year-0 | Year-1 | Year-2 | Year-3 | Year-4 | Year-5 | Year-6 | Year-7 | Year-8 | Year-9 |
|---|---|---|---|---|---|---|---|---|---|---|
| 1980's | 451 | 119 | 58 | 2,820 | 2,728 | 14,387 | ||||
| 1990's | 91 | 38 | 56 | 311 | 46 | 54 | 209 | 46 | 154 | 299 |
| 2000's | 505 | 453 | 643 | 2,162 | 2,429 | 2,868 | 74 | 0 | 75 | 410 |
| 2010's | 517 | 54 | 307 | 22 | 0 | 1 | 0 | 0 | 4 | 8 |
| 2020's | 1 |
| - = No Data Reported; -- = Not Applicable; NA = Not Available; W = Withheld to avoid disclosure of individual company data. |
| Release Date: 2/9/2022 |
| Next Release Date: Suspended |