|
Download Data (XLS File) |
|
|||||
|
|||||
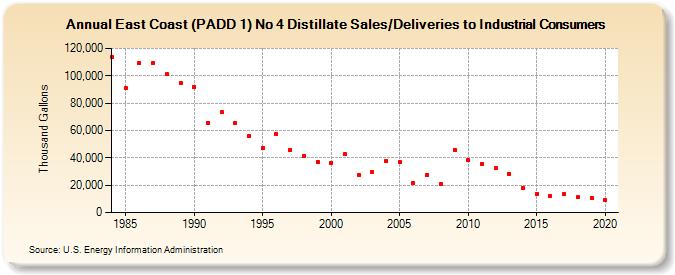
| East Coast (PADD 1) No 4 Distillate Sales/Deliveries to Industrial Consumers (Thousand Gallons) | |||||
| Decade | Year-0 | Year-1 | Year-2 | Year-3 | Year-4 | Year-5 | Year-6 | Year-7 | Year-8 | Year-9 |
|---|---|---|---|---|---|---|---|---|---|---|
| 1980's | 113,708 | 90,979 | 109,241 | 109,422 | 101,079 | 94,750 | ||||
| 1990's | 91,908 | 65,303 | 73,193 | 65,482 | 55,881 | 47,045 | 57,681 | 45,729 | 41,575 | 37,163 |
| 2000's | 36,273 | 42,452 | 27,477 | 29,463 | 37,618 | 37,034 | 21,338 | 27,743 | 20,692 | 45,578 |
| 2010's | 38,427 | 35,758 | 32,483 | 28,374 | 17,902 | 13,742 | 12,219 | 13,564 | 11,172 | 10,838 |
| 2020's | 8,861 |
| - = No Data Reported; -- = Not Applicable; NA = Not Available; W = Withheld to avoid disclosure of individual company data. |
| Release Date: 2/9/2022 |
| Next Release Date: Suspended |