|
Download Data (XLS File) |
|
|||||
|
|||||
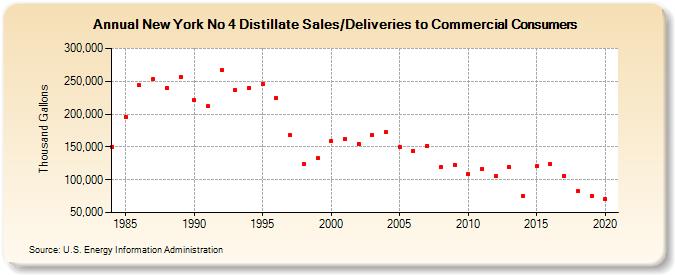
| New York No 4 Distillate Sales/Deliveries to Commercial Consumers (Thousand Gallons) | |||||
| Decade | Year-0 | Year-1 | Year-2 | Year-3 | Year-4 | Year-5 | Year-6 | Year-7 | Year-8 | Year-9 |
|---|---|---|---|---|---|---|---|---|---|---|
| 1980's | 150,457 | 195,390 | 243,557 | 252,986 | 240,121 | 256,421 | ||||
| 1990's | 221,389 | 211,984 | 267,180 | 236,308 | 240,219 | 245,710 | 224,643 | 167,710 | 123,629 | 132,576 |
| 2000's | 158,669 | 162,215 | 155,087 | 168,296 | 172,271 | 149,538 | 144,089 | 151,782 | 119,321 | 122,558 |
| 2010's | 108,973 | 116,863 | 105,033 | 119,123 | 75,842 | 120,366 | 123,587 | 106,130 | 82,074 | 75,765 |
| 2020's | 70,649 |
| - = No Data Reported; -- = Not Applicable; NA = Not Available; W = Withheld to avoid disclosure of individual company data. |
| Release Date: 2/9/2022 |
| Next Release Date: Suspended |