|
Download Data (XLS File) |
|
|||||
|
|||||
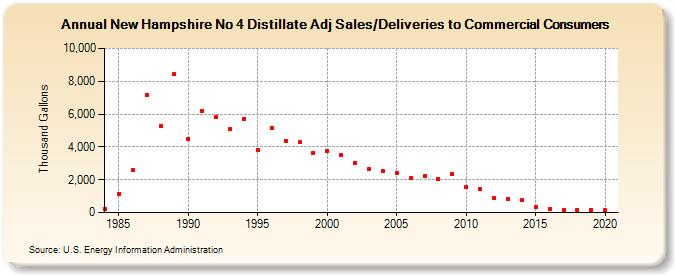
| New Hampshire No 4 Distillate Adj Sales/Deliveries to Commercial Consumers (Thousand Gallons) | |||||
| Decade | Year-0 | Year-1 | Year-2 | Year-3 | Year-4 | Year-5 | Year-6 | Year-7 | Year-8 | Year-9 |
|---|---|---|---|---|---|---|---|---|---|---|
| 1980's | 239 | 1,156 | 2,599 | 7,170 | 5,288 | 8,442 | ||||
| 1990's | 4,510 | 6,172 | 5,796 | 5,071 | 5,726 | 3,831 | 5,178 | 4,374 | 4,281 | 3,628 |
| 2000's | 3,756 | 3,502 | 3,037 | 2,632 | 2,514 | 2,404 | 2,103 | 2,222 | 2,048 | 2,375 |
| 2010's | 1,570 | 1,449 | 917 | 852 | 755 | 366 | 223 | 164 | 146 | 152 |
| 2020's | 127 |
| - = No Data Reported; -- = Not Applicable; NA = Not Available; W = Withheld to avoid disclosure of individual company data. |
| Release Date: 2/9/2022 |
| Next Release Date: Suspended |