|
Download Data (XLS File) |
|
|||||
|
|||||
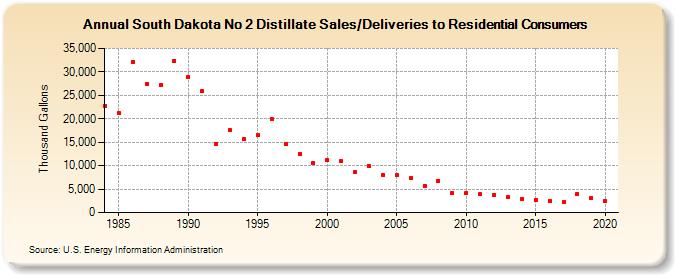
| South Dakota No 2 Distillate Sales/Deliveries to Residential Consumers (Thousand Gallons) | |||||
| Decade | Year-0 | Year-1 | Year-2 | Year-3 | Year-4 | Year-5 | Year-6 | Year-7 | Year-8 | Year-9 |
|---|---|---|---|---|---|---|---|---|---|---|
| 1980's | 22,784 | 21,174 | 32,184 | 27,355 | 27,089 | 32,405 | ||||
| 1990's | 28,939 | 25,911 | 14,596 | 17,519 | 15,593 | 16,503 | 19,935 | 14,684 | 12,499 | 10,485 |
| 2000's | 11,206 | 10,901 | 8,541 | 9,947 | 8,044 | 7,917 | 7,264 | 5,670 | 6,759 | 4,183 |
| 2010's | 4,188 | 3,947 | 3,812 | 3,259 | 2,949 | 2,780 | 2,525 | 2,283 | 3,938 | 3,174 |
| 2020's | 2,415 |
| - = No Data Reported; -- = Not Applicable; NA = Not Available; W = Withheld to avoid disclosure of individual company data. |
| Release Date: 2/9/2022 |
| Next Release Date: Suspended |