|
Download Data (XLS File) |
|
|||||
|
|||||
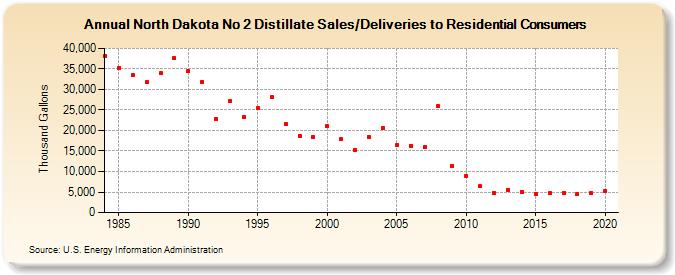
| North Dakota No 2 Distillate Sales/Deliveries to Residential Consumers (Thousand Gallons) | |||||
| Decade | Year-0 | Year-1 | Year-2 | Year-3 | Year-4 | Year-5 | Year-6 | Year-7 | Year-8 | Year-9 |
|---|---|---|---|---|---|---|---|---|---|---|
| 1980's | 38,209 | 35,250 | 33,457 | 31,722 | 33,891 | 37,636 | ||||
| 1990's | 34,459 | 31,875 | 22,684 | 27,098 | 23,276 | 25,372 | 28,150 | 21,485 | 18,734 | 18,464 |
| 2000's | 21,001 | 17,880 | 15,318 | 18,410 | 20,650 | 16,386 | 16,310 | 15,963 | 25,877 | 11,354 |
| 2010's | 8,914 | 6,399 | 4,857 | 5,600 | 5,102 | 4,477 | 4,671 | 4,874 | 4,403 | 4,783 |
| 2020's | 5,288 |
| - = No Data Reported; -- = Not Applicable; NA = Not Available; W = Withheld to avoid disclosure of individual company data. |
| Release Date: 2/9/2022 |
| Next Release Date: Suspended |