|
Download Data (XLS File) |
|
|||||
|
|||||
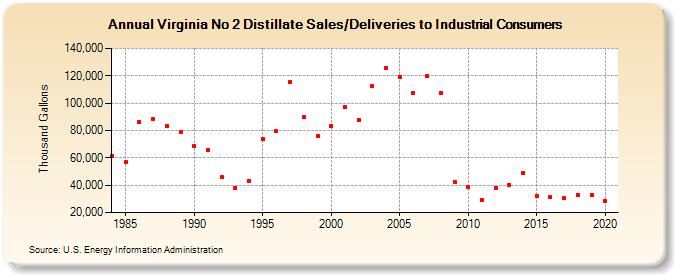
| Virginia No 2 Distillate Sales/Deliveries to Industrial Consumers (Thousand Gallons) | |||||
| Decade | Year-0 | Year-1 | Year-2 | Year-3 | Year-4 | Year-5 | Year-6 | Year-7 | Year-8 | Year-9 |
|---|---|---|---|---|---|---|---|---|---|---|
| 1980's | 61,108 | 56,698 | 86,094 | 88,650 | 83,597 | 78,727 | ||||
| 1990's | 68,454 | 65,679 | 45,637 | 38,048 | 42,820 | 73,955 | 79,275 | 115,400 | 90,075 | 76,065 |
| 2000's | 83,320 | 97,176 | 87,807 | 112,304 | 125,453 | 119,200 | 107,693 | 119,676 | 107,562 | 42,368 |
| 2010's | 38,684 | 29,498 | 38,149 | 40,449 | 48,768 | 31,774 | 31,047 | 30,328 | 33,052 | 32,716 |
| 2020's | 28,449 |
| - = No Data Reported; -- = Not Applicable; NA = Not Available; W = Withheld to avoid disclosure of individual company data. |
| Release Date: 2/9/2022 |
| Next Release Date: Suspended |