|
Download Data (XLS File) |
|
|||||
|
|||||
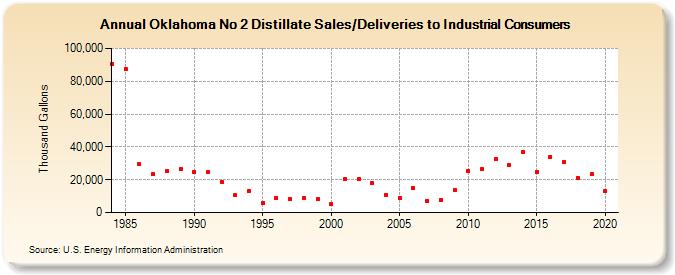
| Oklahoma No 2 Distillate Sales/Deliveries to Industrial Consumers (Thousand Gallons) | |||||
| Decade | Year-0 | Year-1 | Year-2 | Year-3 | Year-4 | Year-5 | Year-6 | Year-7 | Year-8 | Year-9 |
|---|---|---|---|---|---|---|---|---|---|---|
| 1980's | 90,454 | 87,331 | 29,280 | 23,306 | 25,347 | 26,493 | ||||
| 1990's | 24,994 | 24,527 | 18,727 | 10,513 | 13,010 | 5,765 | 9,079 | 8,193 | 9,167 | 8,116 |
| 2000's | 5,348 | 20,238 | 20,325 | 17,804 | 10,989 | 9,005 | 14,915 | 6,923 | 7,703 | 13,781 |
| 2010's | 25,250 | 26,340 | 32,450 | 28,732 | 37,162 | 24,685 | 33,900 | 30,818 | 21,264 | 23,309 |
| 2020's | 12,857 |
| - = No Data Reported; -- = Not Applicable; NA = Not Available; W = Withheld to avoid disclosure of individual company data. |
| Release Date: 2/9/2022 |
| Next Release Date: Suspended |