|
Download Data (XLS File) |
|
|||||
|
|||||
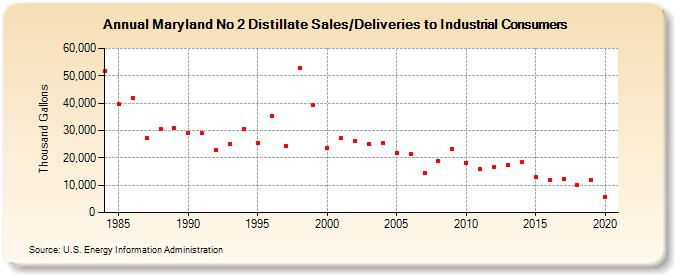
| Maryland No 2 Distillate Sales/Deliveries to Industrial Consumers (Thousand Gallons) | |||||
| Decade | Year-0 | Year-1 | Year-2 | Year-3 | Year-4 | Year-5 | Year-6 | Year-7 | Year-8 | Year-9 |
|---|---|---|---|---|---|---|---|---|---|---|
| 1980's | 51,917 | 39,557 | 41,883 | 27,207 | 30,569 | 30,797 | ||||
| 1990's | 29,133 | 28,906 | 22,842 | 25,194 | 30,642 | 25,399 | 35,296 | 24,451 | 52,848 | 39,163 |
| 2000's | 23,678 | 27,278 | 26,009 | 24,916 | 25,478 | 21,806 | 21,479 | 14,492 | 19,003 | 23,048 |
| 2010's | 18,081 | 15,848 | 16,542 | 17,259 | 18,481 | 12,899 | 11,728 | 12,179 | 10,053 | 11,918 |
| 2020's | 5,675 |
| - = No Data Reported; -- = Not Applicable; NA = Not Available; W = Withheld to avoid disclosure of individual company data. |
| Release Date: 2/9/2022 |
| Next Release Date: Suspended |