|
Download Data (XLS File) |
|
|||||
|
|||||
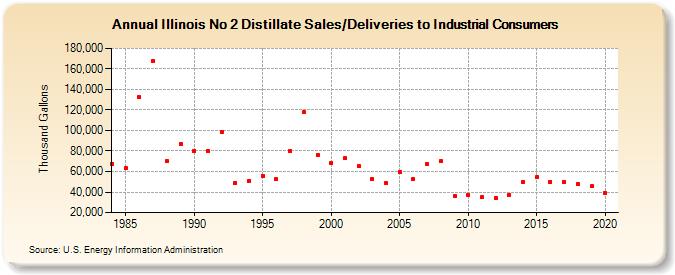
| Illinois No 2 Distillate Sales/Deliveries to Industrial Consumers (Thousand Gallons) | |||||
| Decade | Year-0 | Year-1 | Year-2 | Year-3 | Year-4 | Year-5 | Year-6 | Year-7 | Year-8 | Year-9 |
|---|---|---|---|---|---|---|---|---|---|---|
| 1980's | 67,802 | 63,216 | 132,407 | 167,395 | 70,191 | 86,925 | ||||
| 1990's | 80,267 | 79,826 | 98,831 | 49,259 | 50,789 | 56,011 | 52,322 | 79,834 | 117,543 | 76,411 |
| 2000's | 67,972 | 72,703 | 65,225 | 52,713 | 48,442 | 59,560 | 52,612 | 66,916 | 69,899 | 35,955 |
| 2010's | 37,179 | 34,820 | 34,238 | 37,511 | 49,405 | 54,199 | 50,112 | 49,638 | 47,880 | 45,876 |
| 2020's | 39,087 |
| - = No Data Reported; -- = Not Applicable; NA = Not Available; W = Withheld to avoid disclosure of individual company data. |
| Release Date: 2/9/2022 |
| Next Release Date: Suspended |