|
Download Data (XLS File) |
|
|||||
|
|||||
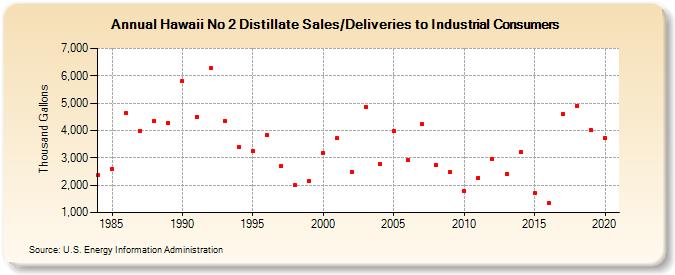
| Hawaii No 2 Distillate Sales/Deliveries to Industrial Consumers (Thousand Gallons) | |||||
| Decade | Year-0 | Year-1 | Year-2 | Year-3 | Year-4 | Year-5 | Year-6 | Year-7 | Year-8 | Year-9 |
|---|---|---|---|---|---|---|---|---|---|---|
| 1980's | 2,359 | 2,598 | 4,623 | 3,991 | 4,359 | 4,265 | ||||
| 1990's | 5,800 | 4,505 | 6,268 | 4,351 | 3,402 | 3,234 | 3,834 | 2,707 | 1,990 | 2,141 |
| 2000's | 3,169 | 3,714 | 2,483 | 4,869 | 2,767 | 3,974 | 2,919 | 4,230 | 2,735 | 2,468 |
| 2010's | 1,793 | 2,276 | 2,952 | 2,404 | 3,207 | 1,702 | 1,356 | 4,591 | 4,910 | 4,012 |
| 2020's | 3,727 |
| - = No Data Reported; -- = Not Applicable; NA = Not Available; W = Withheld to avoid disclosure of individual company data. |
| Release Date: 2/9/2022 |
| Next Release Date: Suspended |