|
Download Data (XLS File) |
|
|||||
|
|||||
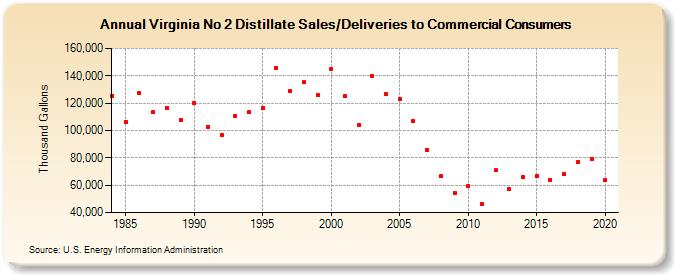
| Virginia No 2 Distillate Sales/Deliveries to Commercial Consumers (Thousand Gallons) | |||||
| Decade | Year-0 | Year-1 | Year-2 | Year-3 | Year-4 | Year-5 | Year-6 | Year-7 | Year-8 | Year-9 |
|---|---|---|---|---|---|---|---|---|---|---|
| 1980's | 125,448 | 106,401 | 127,221 | 113,182 | 116,149 | 107,674 | ||||
| 1990's | 120,046 | 102,542 | 96,588 | 110,257 | 113,192 | 116,378 | 145,752 | 128,749 | 135,199 | 125,617 |
| 2000's | 145,076 | 125,038 | 104,296 | 139,828 | 126,572 | 122,667 | 106,928 | 85,556 | 66,488 | 54,320 |
| 2010's | 59,654 | 46,208 | 71,075 | 57,214 | 65,815 | 66,777 | 63,855 | 67,903 | 76,720 | 79,019 |
| 2020's | 63,784 |
| - = No Data Reported; -- = Not Applicable; NA = Not Available; W = Withheld to avoid disclosure of individual company data. |
| Release Date: 2/9/2022 |
| Next Release Date: Suspended |