|
Download Data (XLS File) |
|
|||||
|
|||||
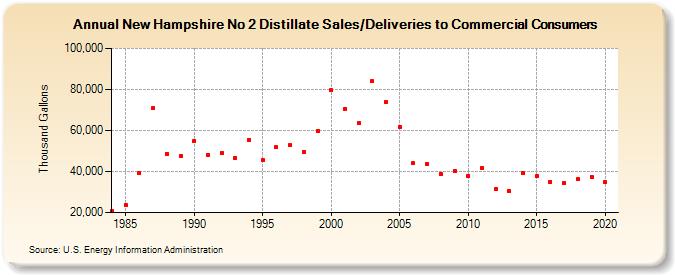
| New Hampshire No 2 Distillate Sales/Deliveries to Commercial Consumers (Thousand Gallons) | |||||
| Decade | Year-0 | Year-1 | Year-2 | Year-3 | Year-4 | Year-5 | Year-6 | Year-7 | Year-8 | Year-9 |
|---|---|---|---|---|---|---|---|---|---|---|
| 1980's | 20,581 | 23,571 | 39,474 | 70,829 | 48,682 | 47,559 | ||||
| 1990's | 54,906 | 48,063 | 49,196 | 46,486 | 55,569 | 45,390 | 51,821 | 52,967 | 49,742 | 59,815 |
| 2000's | 79,534 | 70,569 | 63,533 | 83,941 | 73,957 | 61,753 | 43,914 | 43,582 | 38,822 | 40,307 |
| 2010's | 38,042 | 41,864 | 31,386 | 30,482 | 39,173 | 37,763 | 35,070 | 34,355 | 36,309 | 37,381 |
| 2020's | 34,663 |
| - = No Data Reported; -- = Not Applicable; NA = Not Available; W = Withheld to avoid disclosure of individual company data. |
| Release Date: 2/9/2022 |
| Next Release Date: Suspended |