|
Download Data (XLS File) |
|
|||||
|
|||||
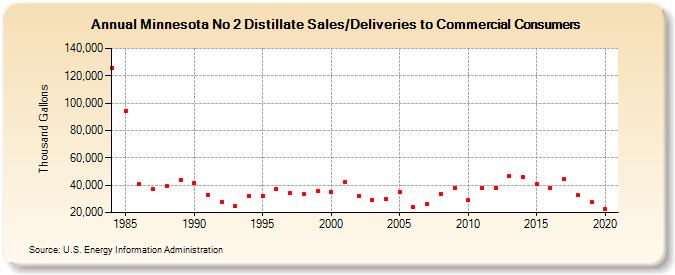
| Minnesota No 2 Distillate Sales/Deliveries to Commercial Consumers (Thousand Gallons) | |||||
| Decade | Year-0 | Year-1 | Year-2 | Year-3 | Year-4 | Year-5 | Year-6 | Year-7 | Year-8 | Year-9 |
|---|---|---|---|---|---|---|---|---|---|---|
| 1980's | 125,573 | 94,338 | 40,536 | 37,267 | 39,216 | 43,895 | ||||
| 1990's | 41,604 | 33,187 | 27,926 | 24,605 | 31,828 | 32,380 | 37,242 | 34,210 | 33,572 | 35,444 |
| 2000's | 35,067 | 42,259 | 31,830 | 29,530 | 29,925 | 34,779 | 24,293 | 26,233 | 33,435 | 37,863 |
| 2010's | 29,384 | 37,929 | 38,135 | 46,414 | 46,011 | 40,786 | 38,217 | 44,479 | 32,776 | 27,730 |
| 2020's | 22,366 |
| - = No Data Reported; -- = Not Applicable; NA = Not Available; W = Withheld to avoid disclosure of individual company data. |
| Release Date: 2/9/2022 |
| Next Release Date: Suspended |