|
Download Data (XLS File) |
|
|||||
|
|||||
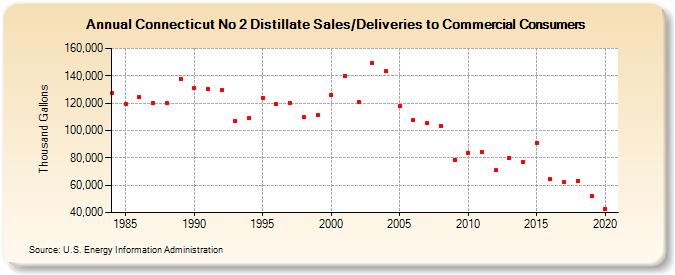
| Connecticut No 2 Distillate Sales/Deliveries to Commercial Consumers (Thousand Gallons) | |||||
| Decade | Year-0 | Year-1 | Year-2 | Year-3 | Year-4 | Year-5 | Year-6 | Year-7 | Year-8 | Year-9 |
|---|---|---|---|---|---|---|---|---|---|---|
| 1980's | 127,172 | 119,070 | 124,580 | 120,033 | 119,905 | 137,454 | ||||
| 1990's | 131,281 | 130,627 | 129,907 | 106,945 | 109,166 | 124,103 | 119,605 | 119,731 | 110,132 | 111,002 |
| 2000's | 126,108 | 140,028 | 120,831 | 149,226 | 143,281 | 118,195 | 107,481 | 105,735 | 103,405 | 78,532 |
| 2010's | 83,329 | 84,528 | 71,102 | 80,093 | 76,800 | 91,076 | 64,400 | 61,983 | 63,392 | 52,200 |
| 2020's | 42,916 |
| - = No Data Reported; -- = Not Applicable; NA = Not Available; W = Withheld to avoid disclosure of individual company data. |
| Release Date: 2/9/2022 |
| Next Release Date: Suspended |