|
Download Data (XLS File) |
|
|||||
|
|||||
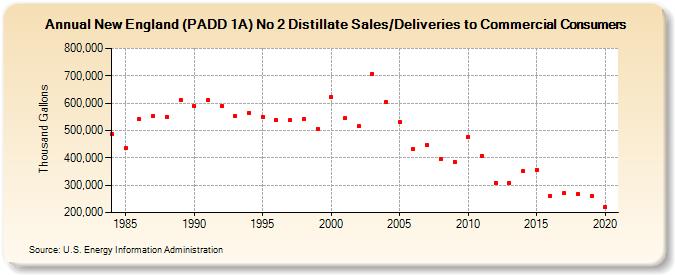
| New England (PADD 1A) No 2 Distillate Sales/Deliveries to Commercial Consumers (Thousand Gallons) | |||||
| Decade | Year-0 | Year-1 | Year-2 | Year-3 | Year-4 | Year-5 | Year-6 | Year-7 | Year-8 | Year-9 |
|---|---|---|---|---|---|---|---|---|---|---|
| 1980's | 487,237 | 436,212 | 540,360 | 551,526 | 550,169 | 611,997 | ||||
| 1990's | 588,756 | 609,707 | 590,487 | 552,510 | 564,878 | 550,345 | 538,420 | 537,554 | 541,286 | 506,868 |
| 2000's | 623,200 | 544,819 | 515,223 | 708,032 | 604,476 | 531,053 | 432,160 | 447,731 | 396,840 | 386,333 |
| 2010's | 476,900 | 407,728 | 308,416 | 309,317 | 351,689 | 357,246 | 261,185 | 270,230 | 267,575 | 259,815 |
| 2020's | 220,225 |
| - = No Data Reported; -- = Not Applicable; NA = Not Available; W = Withheld to avoid disclosure of individual company data. |
| Release Date: 2/9/2022 |
| Next Release Date: Suspended |