|
Download Data (XLS File) |
|
|||||
|
|||||
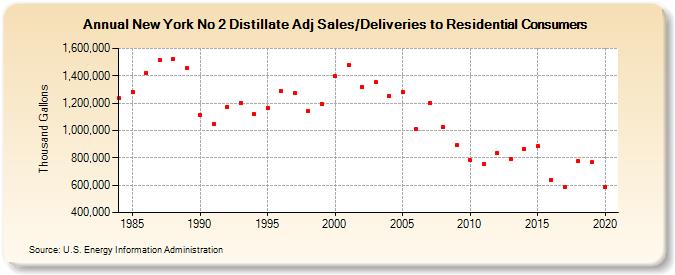
| New York No 2 Distillate Adj Sales/Deliveries to Residential Consumers (Thousand Gallons) | |||||
| Decade | Year-0 | Year-1 | Year-2 | Year-3 | Year-4 | Year-5 | Year-6 | Year-7 | Year-8 | Year-9 |
|---|---|---|---|---|---|---|---|---|---|---|
| 1980's | 1,234,116 | 1,283,392 | 1,419,446 | 1,514,408 | 1,523,827 | 1,453,176 | ||||
| 1990's | 1,109,877 | 1,048,616 | 1,173,864 | 1,204,239 | 1,119,879 | 1,165,204 | 1,288,927 | 1,272,482 | 1,139,875 | 1,194,639 |
| 2000's | 1,395,845 | 1,478,178 | 1,320,838 | 1,353,866 | 1,252,166 | 1,282,652 | 1,010,288 | 1,200,602 | 1,026,451 | 890,895 |
| 2010's | 782,330 | 752,342 | 834,104 | 793,891 | 866,149 | 886,504 | 640,874 | 589,294 | 773,498 | 767,210 |
| 2020's | 585,112 |
| - = No Data Reported; -- = Not Applicable; NA = Not Available; W = Withheld to avoid disclosure of individual company data. |
| Release Date: 2/9/2022 |
| Next Release Date: Suspended |