|
Download Data (XLS File) |
|
|||||
|
|||||
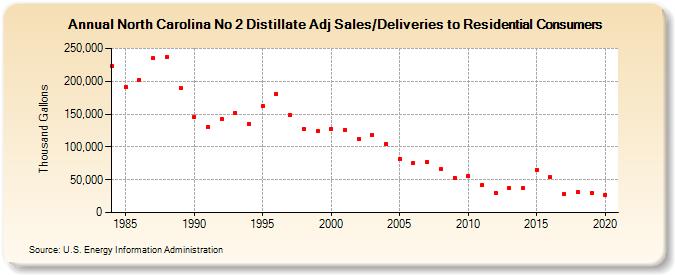
| North Carolina No 2 Distillate Adj Sales/Deliveries to Residential Consumers (Thousand Gallons) | |||||
| Decade | Year-0 | Year-1 | Year-2 | Year-3 | Year-4 | Year-5 | Year-6 | Year-7 | Year-8 | Year-9 |
|---|---|---|---|---|---|---|---|---|---|---|
| 1980's | 222,916 | 190,972 | 202,337 | 234,980 | 237,380 | 189,315 | ||||
| 1990's | 145,480 | 130,306 | 142,996 | 152,109 | 135,610 | 162,343 | 181,291 | 148,360 | 127,982 | 124,467 |
| 2000's | 127,951 | 126,176 | 112,777 | 118,714 | 104,845 | 81,528 | 75,678 | 77,376 | 66,421 | 53,007 |
| 2010's | 56,308 | 41,323 | 30,254 | 37,389 | 37,190 | 65,415 | 53,812 | 28,469 | 31,463 | 29,430 |
| 2020's | 27,120 |
| - = No Data Reported; -- = Not Applicable; NA = Not Available; W = Withheld to avoid disclosure of individual company data. |
| Release Date: 2/9/2022 |
| Next Release Date: Suspended |