|
Download Data (XLS File) |
|
|||||
|
|||||
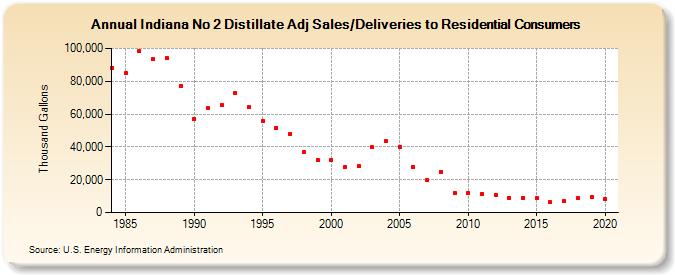
| Indiana No 2 Distillate Adj Sales/Deliveries to Residential Consumers (Thousand Gallons) | |||||
| Decade | Year-0 | Year-1 | Year-2 | Year-3 | Year-4 | Year-5 | Year-6 | Year-7 | Year-8 | Year-9 |
|---|---|---|---|---|---|---|---|---|---|---|
| 1980's | 88,100 | 84,724 | 98,207 | 93,469 | 94,016 | 76,880 | ||||
| 1990's | 57,014 | 63,524 | 65,388 | 72,779 | 64,094 | 55,543 | 51,770 | 48,095 | 36,750 | 32,091 |
| 2000's | 32,143 | 27,448 | 28,088 | 39,706 | 43,295 | 40,099 | 27,938 | 19,666 | 24,846 | 12,157 |
| 2010's | 11,846 | 11,559 | 10,792 | 9,098 | 8,833 | 8,855 | 6,249 | 6,777 | 8,773 | 9,746 |
| 2020's | 8,203 |
| - = No Data Reported; -- = Not Applicable; NA = Not Available; W = Withheld to avoid disclosure of individual company data. |
| Release Date: 2/9/2022 |
| Next Release Date: Suspended |